
Free Monthly SEO Report Template: Structure and KPIs
Quick answer
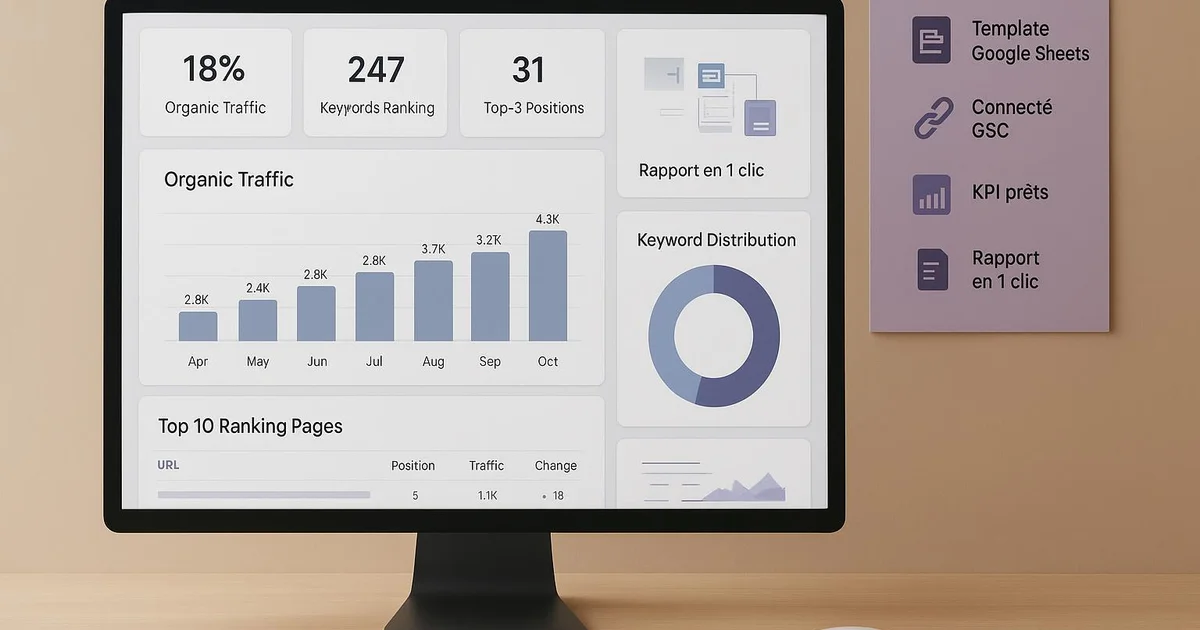
A free monthly SEO report template is a ready-to-fill model that organizes key KPIs (organic traffic, rankings, clicks, impressions, conversions) into clear sections. It typically connects to Google Search Console and Google Analytics to centralize data, and can be automated to avoid manual re-entry every month.
At the end of every month, the same chore returns: compiling Search Console figures, exporting Analytics, pasting screenshots, and trying to tell a coherent story to a client or management. Yet the monthly SEO report is a critical deliverable: poorly built, it buries the essentials under vanity metrics; well built, it justifies the budget and guides strategy. A free monthly SEO report template solves part of the problem by imposing a reproducible structure and relevant KPIs. In this article, we detail the structure of an effective model, the indicators to keep, the data sources to connect, and common pitfalls. We also show how Selfhook provides a pre-filled template connected to Google Search Console, usable alone or automated for teams producing multiple reports per month.
Definition
A monthly SEO report template is a structured model that gathers organic performance indicators over a one-month period, in order to measure trends, explain variations, and guide SEO decisions.
What should a monthly SEO report template contain?
A good monthly SEO report template follows a top-down logic: from the executive summary toward technical detail. This hierarchy lets a busy decision-maker grasp the essentials in thirty seconds, while leaving a practitioner the ability to dig deeper. The first section is always an executive summary: three to five sentences summarizing the evolution of organic traffic, the key facts, and the month's actions. It is the most-read and often the most neglected part. Next comes a block of main KPIs presented as figures compared to the previous month and the previous year (variation as a percentage and in absolute value). The core of the report then develops the analyses: ranking evolution on tracked keywords, top-performing pages, emerging queries, and visibility losses. We add a technical layer (indexing, Core Web Vitals, crawl errors reported by Google Search Console) and a content layer (pages published, optimizations carried out). Finally, the "next actions" section turns observation into a plan. Without it, a report remains descriptive and fails to justify the value of the work.
- Executive summary (3-5 sentences)
- Main KPIs with month-over-month and year-over-year comparison
- Ranking evolution and tracked keywords
- Top-performing pages and queries
- Technical health (indexing, Core Web Vitals)
- Content published and optimizations completed
- Prioritized next actions
Which KPIs to keep in a monthly SEO report?
The choice of KPIs determines the quality of a report. The classic mistake is stacking impressive but barely actionable metrics. An effective template distinguishes outcome indicators (what you aim to improve) from activity indicators (what you produced). On the outcome side, four to six KPIs are usually enough. Organic clicks and impressions, drawn directly from Google Search Console, measure real visibility. Average position, to be interpreted cautiously because it aggregates heterogeneous queries, gives a trend. Organic CTR links impressions and clicks. Finally, organic conversions (forms, sales, leads) connect SEO to revenue — the KPI that speaks most to management. On the activity side, you document the number of content pieces published, the on-page optimizations carried out, and technical fixes. These indicators explain results with a lag, since SEO produces effects over several weeks or even months depending on the topic. It is recommended to present each KPI with three elements: the month's value, the variation versus the previous month, and the annual variation to neutralize seasonality. Comparing June to December without this perspective leads to erroneous conclusions. All these variations are to be measured in Search Console and Analytics, and should be presented as contextualized observations, not certainties. An isolated KPI means nothing; it is its trajectory over several months that reveals an actionable trend.
- Organic clicks and impressions (Search Console)
- Average position (to be interpreted cautiously)
- Organic CTR by query and by page
- Organic conversions (leads, sales)
- Content published and optimizations completed

Which data sources to connect to the template?
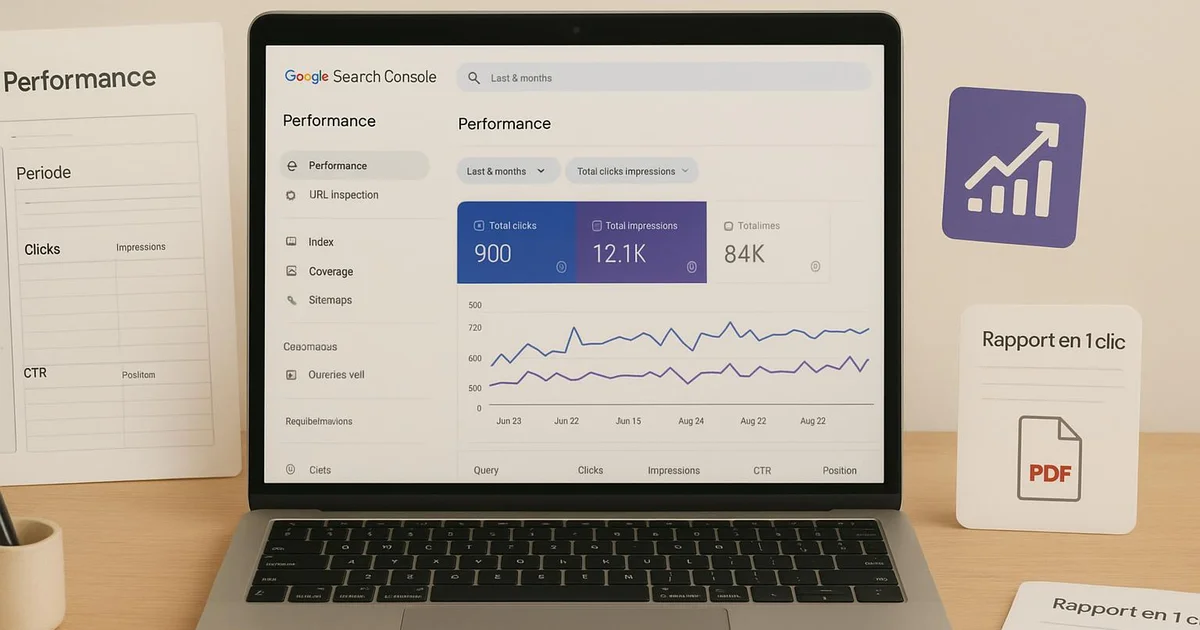
A credible monthly SEO report relies on verifiable, traceable data. Multiplying sources can enrich the analysis but also complicates maintenance. The goal is to balance depth and reproducibility. Google Search Console remains the essential primary source. It provides organic performance data as Google sees it: clicks, impressions, CTR, position, broken down by query, page, country, and device. It is the only official source on visibility in Google Search, and it must form the backbone of the report. Google Analytics (GA4) complements the view with post-click behavior: sessions, engagement, conversions, journeys. It links organic traffic to business results. Be careful, however: gaps between Search Console and Analytics are normal, because the two tools count differently (an impression is not a session). Third-party tools such as Semrush, Ahrefs, RankMath, or Yoast add extra layers: ranking tracking on a set of keywords, backlink analysis, technical audit, content score. This data is valuable but should be presented as estimates, since each tool uses its own collection methodology. A well-designed template systematically indicates the source of each figure and the extraction date. This traceability protects against disputes and makes month-to-month reproduction easier. For teams managing multiple sites, connecting the Search Console API directly avoids manual exports and reduces copy-paste error risks, a topic developed in our guide on automated SEO reporting.
How to automate report production?
Producing a report by hand generally takes between two and four hours per site, depending on the level of detail. For an agency managing ten clients, this represents a considerable, repetitive, and low-value monthly workload. Automation aims to remove collection and formatting to focus human time on analysis. The principle is simple: instead of manually exporting data, you connect the Google Search Console and GA4 APIs to a template that fills itself. KPIs, charts, and comparison tables are generated automatically for the desired period. The operator only intervenes to write the analytical commentary and adjust priorities. Several approaches exist. A spreadsheet connected via scripts offers full control but requires technical skills and maintenance. A business intelligence tool like Looker Studio enables dynamic dashboards but is less suited to narrative monthly deliverables. Finally, specialized pre-connected solutions offer a ready-to-use template with integrated automation. Whatever the choice, two precautions apply. First, automation does not replace analysis: a report generated without human commentary remains a pile of numbers. Second, you must regularly check that API connections remain valid, because a silent break can produce empty or erroneous reports. In some cases, an automated monthly SEO digest sent by email usefully complements the detailed report, alerting the team to notable variations without waiting for the full compilation.
How to make the report readable for a decision-maker?
A technically accurate but unreadable SEO report misses its target. Most recipients — executives, marketing managers, clients — are not SEO experts. The template must therefore translate the technical into business impact. The first rule is to visually prioritize information. Critical KPIs appear at the top, large, with a color code indicating the trend (progress, stability, decline). Technical details go to the bottom or the appendix. A decision-maker should be able to understand overall SEO health without reading a single line of a table. The second rule concerns vocabulary. Saying "average position 4.2 on the transactional cluster" means nothing to an executive. Translating it as "we are now visible on the first page for our most profitable commercial queries" has immediate impact. Each figure must be accompanied by an interpretation in plain language. The third rule is to provide context. A drop in traffic can be positive if accompanied by a rise in conversions, or explained by a Google algorithm update or known seasonality. Without context, a figure invites hasty conclusions. Finally, a good report tells a story: where were we, what happened, where are we going. This narrative gives meaning to data and positions SEO as a strategic lever rather than a cost center. Visuals should serve this narrative, not drown it: three well-chosen charts beat fifteen stacked diagrams.
- Critical KPIs at the top, with a trend color code
- Business translation of each technical metric
- Systematic context (seasonality, Google updates)
- Clear narrative: state, events, outlook
- Limited, chosen visuals, not accumulated
Free template or automated solution: how to choose?
The choice between a free template to fill manually and an automated solution depends mainly on report volume and available time. Both options are legitimate and meet different needs. A free template is perfectly suited to a freelancer managing one to three sites, or to a team starting out and wanting to structure its approach before investing. It offers total flexibility: you adapt the structure to the client, choose your KPIs, customize the presentation. Its financial cost is zero. Its real cost is measured in time: each report requires manual collection and figure updates. An automated solution becomes relevant as soon as volume increases or regularity becomes critical. From five or six sites, the time saved generally justifies the investment, and reducing data-entry errors improves reliability. Automation also ensures presentation consistency across reports, which strengthens perceived professionalism. An intermediate approach, often the most pragmatic, consists of starting from a free template already connected to Search Console. You thus benefit from the structure and automated collection of the main data, while keeping control over analysis and customization. This is the model offered by Selfhook: a pre-filled template usable alone, then fully automated when the need grows. Moving from one to the other happens without changing tools or relearning a structure, which limits the transition cost for a growing team.
With Selfhook, an agency managing eight WordPress sites connects Google Search Console to a pre-filled monthly SEO report template. Clicks, impressions, rankings, and top-performing pages update automatically, with month-over-month and year-over-year comparison. Beyond reporting, Selfhook generates and publishes optimized content via its SEO audit and automated WordPress publishing, then measures each piece's impact in the same dashboard. The team thus shifts from manual collection to pure analysis: instead of compiling figures for hours, it directly writes the strategic commentary and next actions from already consolidated and traceable data.
Selfhook centralizes content generation, SEO/GEO optimization, WordPress publishing and tracking in a single workflow.
See all features →FAQ
Is a free monthly SEO report template enough for an agency?
For one to three engagements, yes, a well-structured free template generally suffices. Beyond five or six sites, the manual collection workload becomes heavy and an automated solution reduces time and error risks. Many teams start with a free template connected to Search Console before automating.
What is the ideal frequency for an SEO report?
Monthly cadence is the standard, as it gives SEO actions time to produce measurable effects while keeping regular tracking. A weekly digest or real-time dashboard can complement the monthly report to quickly detect anomalies.
Why do Search Console and Analytics figures differ?
The two tools measure different things: Search Console counts clicks from Google search results, while Analytics counts sessions on the site. Gaps of 10 to 20% are common and normal. You should clearly indicate the source of each figure in the report.
Should backlinks be included in a monthly SEO report?
It is useful if the strategy includes an active link-building component. Backlink data from Semrush or Ahrefs should be presented as estimates, since each tool has its own database. If the month's work does not focus on links, a summary mention suffices.
Common mistakes
Accumulating vanity metrics
Stacking impressive but non-actionable figures drowns useful information and dilutes the report's value.
Omitting the executive summary
Without a summary at the top, the decision-maker gives up before reaching the important conclusions.
Comparing without accounting for seasonality
Comparing a low month to a strong one without annual variation leads to misleading conclusions.
Delivering data without analysis
An automated report without human commentary remains a pile of numbers that guides no decision.
Not tracing sources
Without mention of the source and extraction date, a figure becomes impossible to verify or reproduce.
Operational checklist
Action plan
- 1
Choose and customize the template
Start from a structured free template, then adapt the sections to the client's or management's objectives.
- 2
Connect the data sources
Link Google Search Console and GA4 to the template. Check the consistency of periods and selected properties.
- 3
Define KPIs and comparison benchmarks
Select outcome and activity indicators, and set month-over-month and year-over-year comparisons.
- 4
Automate collection
Set up automatic data updates via API to eliminate recurring manual exports.
- 5
Write the analysis and actions
Add human commentary: interpretation of variations, context, and a prioritized action plan for the following month.
Free manual template vs automated solution
| Criterion | Free template | Automated solution |
|---|---|---|
| Financial cost | None | Variable subscription |
| Time per report | 2 to 4 h (estimated) | 20 to 40 min (estimated) |
| Data-entry error risk | High | Low |
| Suitable volume | 1 to 3 sites | 5 sites and more |
| Consistency across reports | Variable | Strong |
Key takeaways
Structure the report top-down from executive summary to technical detail
Keep 4 to 6 outcome KPIs rather than accumulating metrics
Make Google Search Console your traceable primary source
Always compare with the previous month and previous year
Automate collection but keep human analysis
Translate each technical figure into business impact
A freelance SEO managed five e-commerce clients and spent around three hours per report, meaning fifteen monthly hours of collection and formatting. She adopted a template connected to Google Search Console with automatic updates of clicks, impressions, and rankings. Result observed over three months: time per report dropped to about forty minutes, spent almost exclusively on analysis and recommendations. One client was thus able to identify that a 12% traffic drop actually masked an 8% rise in organic conversions, thanks to contextualized commentary that the previous manual template never highlighted. The perceived reliability of deliverables improved significantly.
The average position shown by Google Search Console aggregates all queries and all pages of a property. A global variation can therefore mask opposing movements: a decline on low-value queries and progress on transactional ones. For reliable analysis, segment by query group or by page before concluding. Likewise, average CTR is strongly influenced by the share of brand queries, which are better isolated to judge real performance on generic queries.
Related cluster articles
Reference guides
Automate with Selfhook
Conclusion
A free monthly SEO report template is an excellent starting point for structuring a credible, reproducible deliverable. The essentials lie in three principles: a top-down structure from summary to detail, a tight selection of actionable KPIs, and rigorous source traceability. Automation becomes relevant as report volume increases, provided you preserve the human analysis that gives meaning to the figures. Selfhook offers precisely this progressive path: a pre-filled template connected to Search Console, usable alone then automated for teams. Start by structuring, measure in Search Console, then automate when the workload justifies it.
Ready to automate your SEO content?
Discover how Selfhook can help you create and publish quality SEO content
Start for free